
CSD Console Walkthrough
Dashboard
Section titled “Dashboard”Navigate to the Client-Side Defense dashboard in the XC Console.
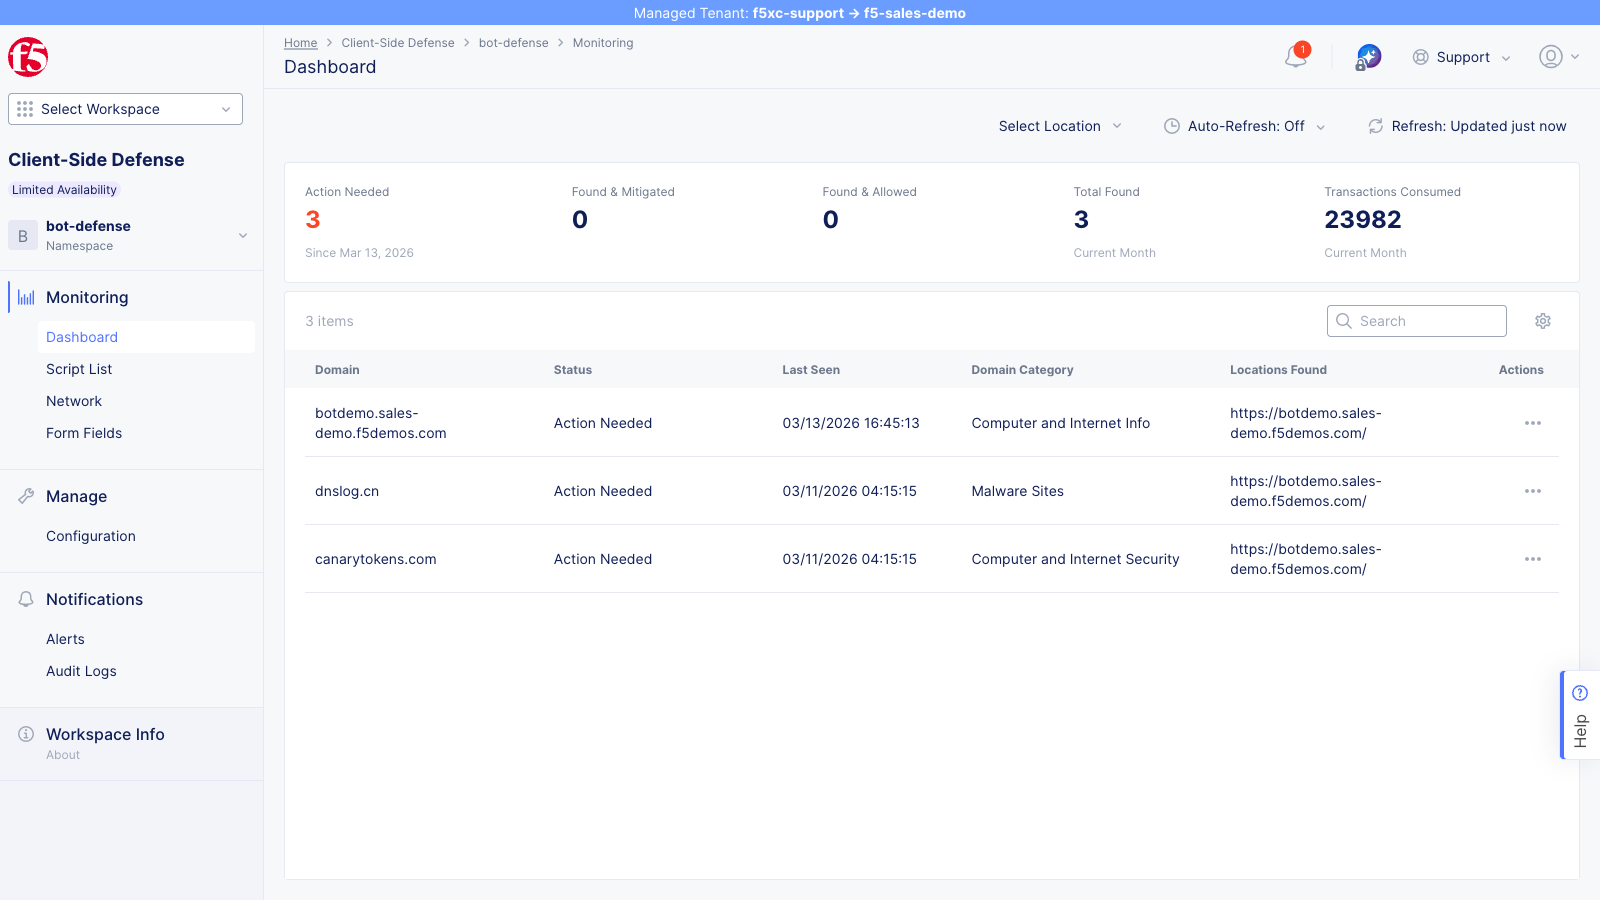
The summary cards show actioned script domains:
- Action Needed — script domains (both first-party and third-party) flagged for review but not yet actioned
- Found & Mitigated — domains where scripts have been added to the mitigate list (only changes after admin action)
- Found & Allowed — domains explicitly added to the allow list (only changes after admin action)
- Total Found — all script domains detected in the current period (updates automatically with new detections)
- Transactions Consumed — CSD telemetry events processed this month (confirms CSD is active)
The domain table lists all domains that CSD has detected — including both first-party and third-party script source domains, as well as fetch/XHR destination domains. Each row shows the domain status, last seen timestamp, domain category, and the locations (URLs) where activity from that domain was observed.
The screenshot above shows domains detected on the demo tenant, all in Action Needed status. The specific domains visible depend on which simulations have been run:
| Domain | Category | Origin |
|---|---|---|
botdemo.sales-demo.f5demos.com | Computer and Internet Info | Protected application domain |
dnslog.cn | Malware Sites | Data-exfiltration simulation script |
canarytokens.com | Computer and Internet Security | Data-exfiltration simulation script |
After running the combined simulation and actioning the injected CDN domains (cdn.jsdelivr.net, esm.sh, unpkg.com, ga.jspm.io) via the actions menu, those domains will also appear in the table with Found & Allowed or Found & Mitigated status.
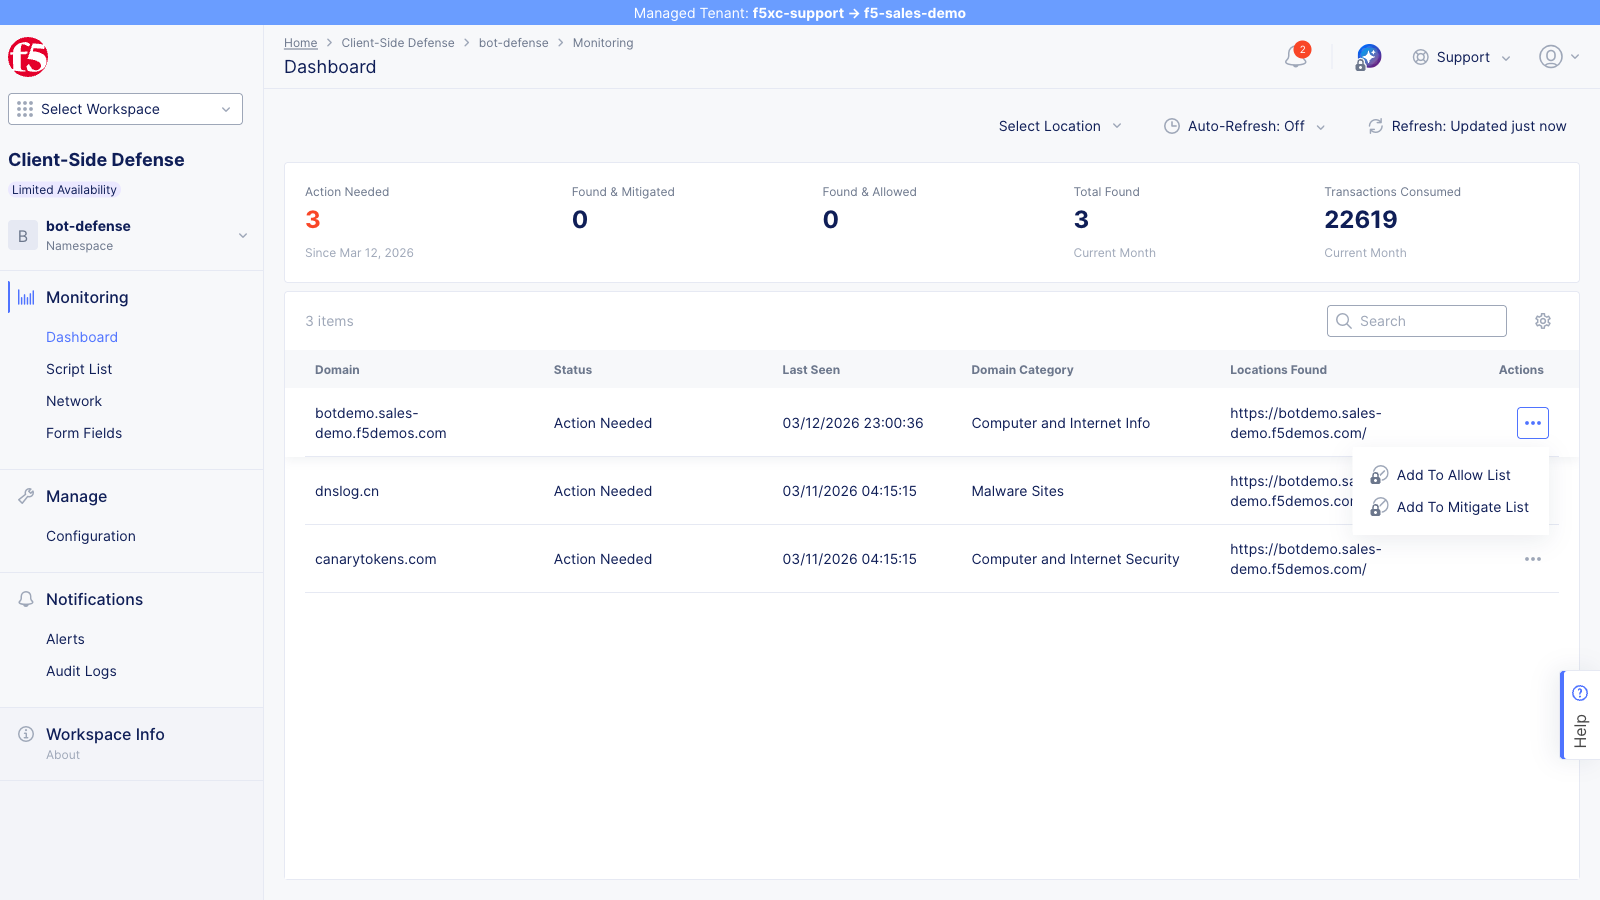
Click the … actions menu on a domain row to see available actions: Add To Allow List and Add To Mitigate List.
Script Inventory
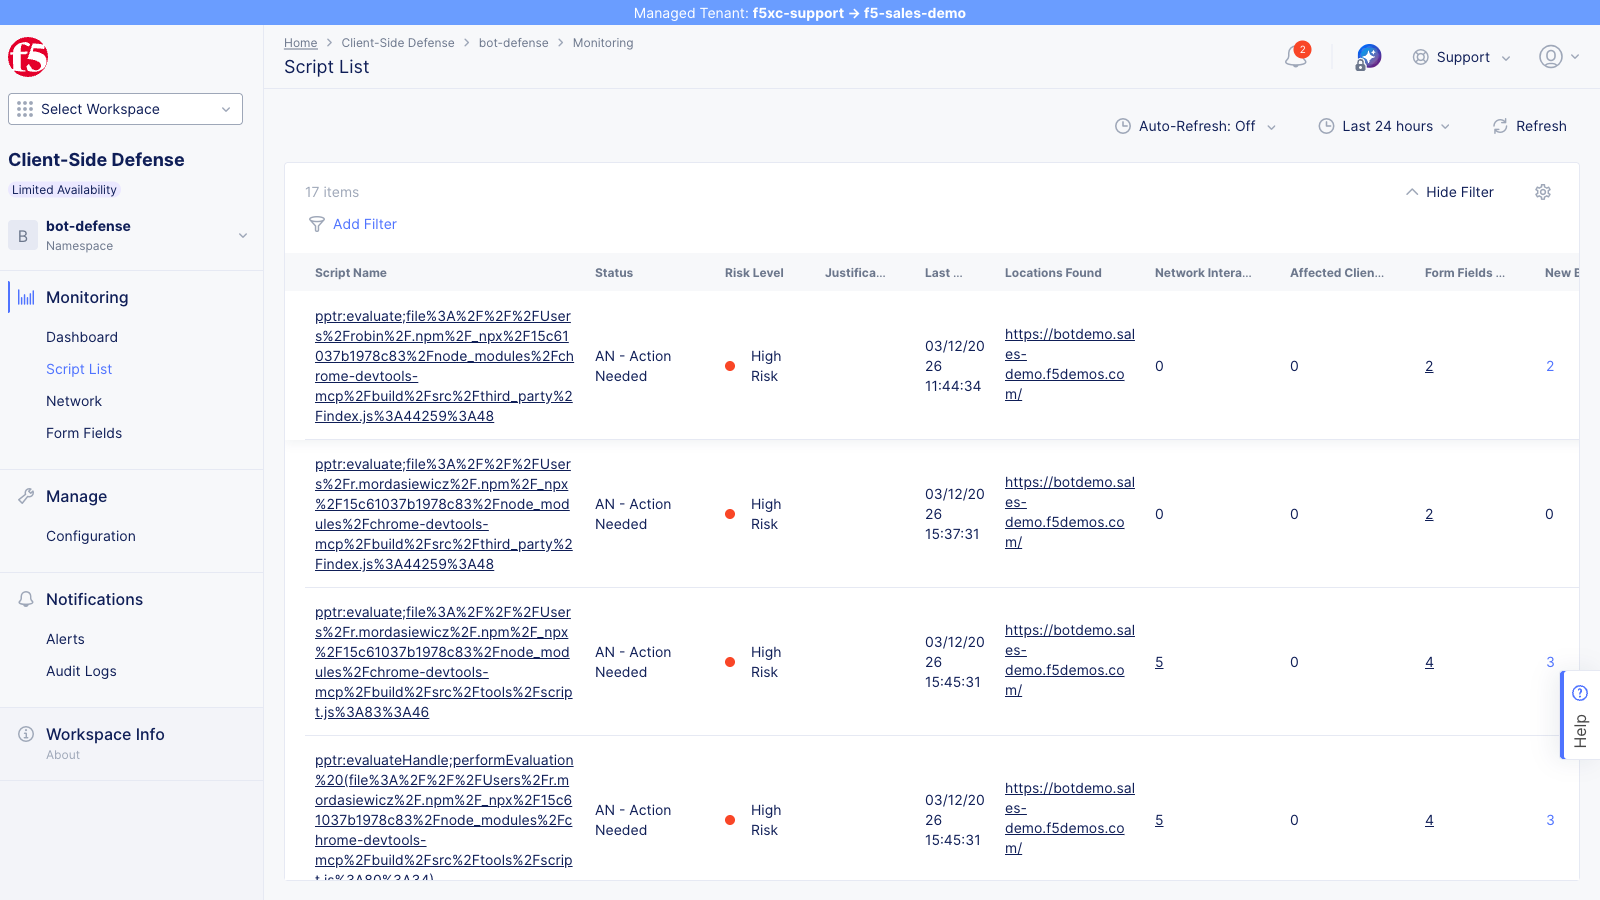
Section titled “Script Inventory”Open the Script List from the left navigation to view all detected scripts.
| Field | Description |
|---|---|
| Script Name | Full URL of the JavaScript file |
| Status | AN (Action Needed) or NA (No Action Needed) |
| Risk Level | No Risk, Low Risk, or High Risk |
| Justification | Why CSD flagged the script |
| Last Seen | Most recent detection timestamp |
| Locations Found | Number of pages where the script was observed |
| Network Interactions | Count of network calls made by the script |
| Form Fields | Number of form fields the script reads |
| Affected Clients | Number of unique users/sessions affected by the script |
After running the combined simulation, you should see:
- Application scripts (e.g.,
main.js,vendor.js) flagged as High Risk / Action Needed because they read sensitive form fields (email, password) - 4 new third-party scripts from
cdn.jsdelivr.net,esm.sh,unpkg.com, andga.jspm.ioappearing as new entries in the list
-
Sort by Risk Level (High Risk first)
-
Click a high-risk script (e.g.,
main.js) to view its detail page -
The Overview tab shows a Behaviors Over Time chart tracking the script’s risk level, source domain, and type over time
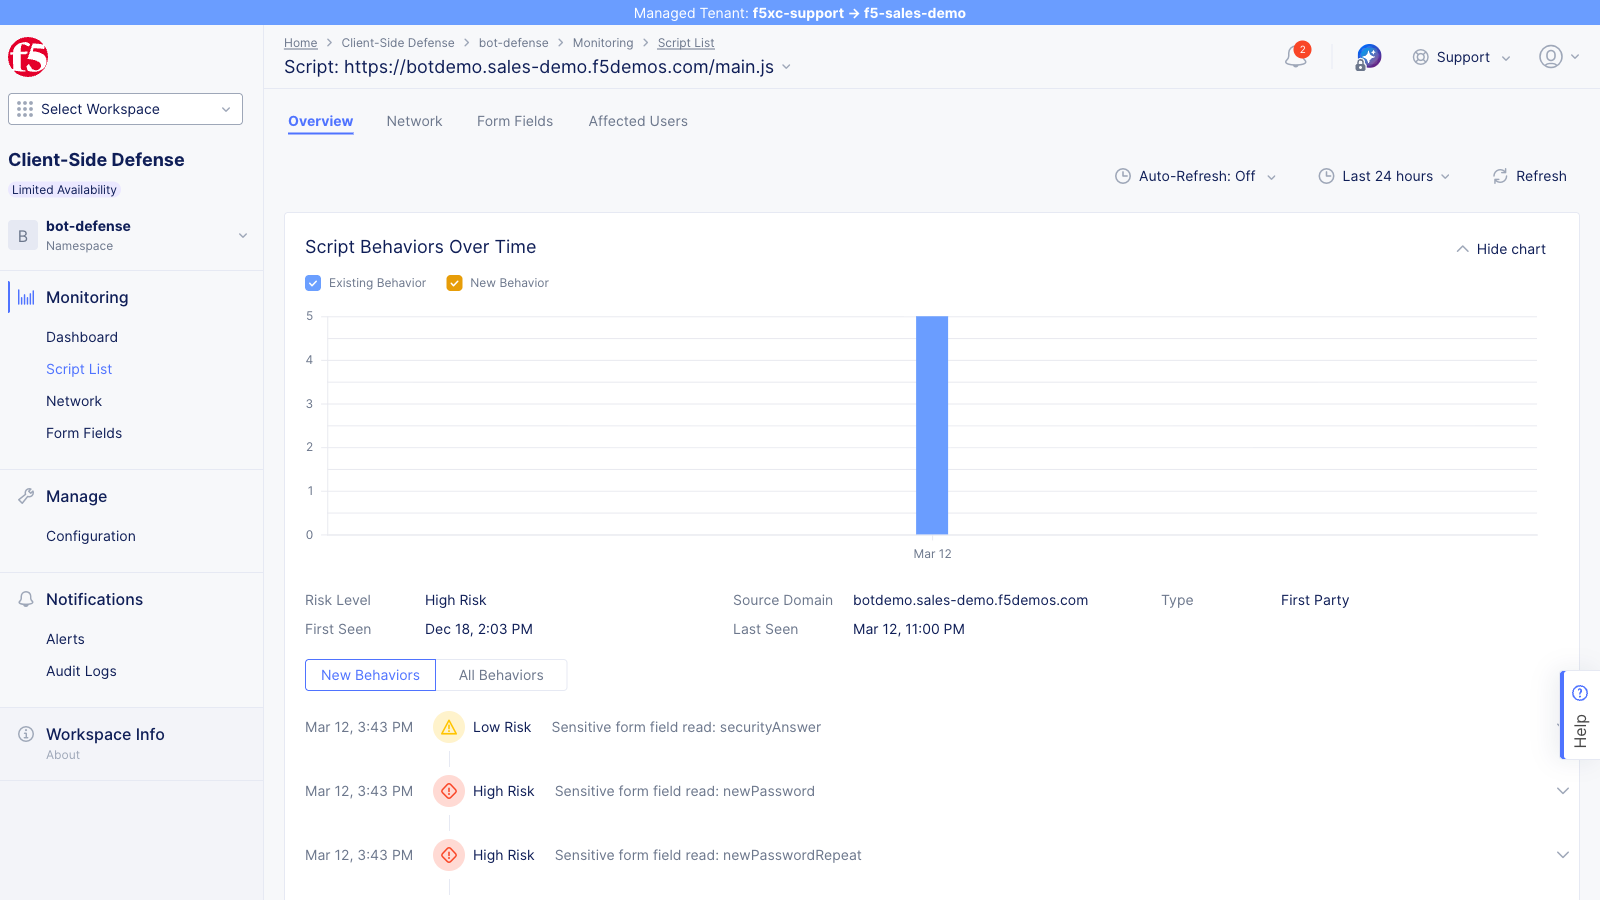
-
Click the Form Fields tab to see which specific fields the script is reading
-
Click the Affected Users tab to see which users were impacted (see the Affected Users section below)
Form Fields
Section titled “Form Fields”The Form Fields view shows all form fields that CSD detected scripts reading across the monitored site.
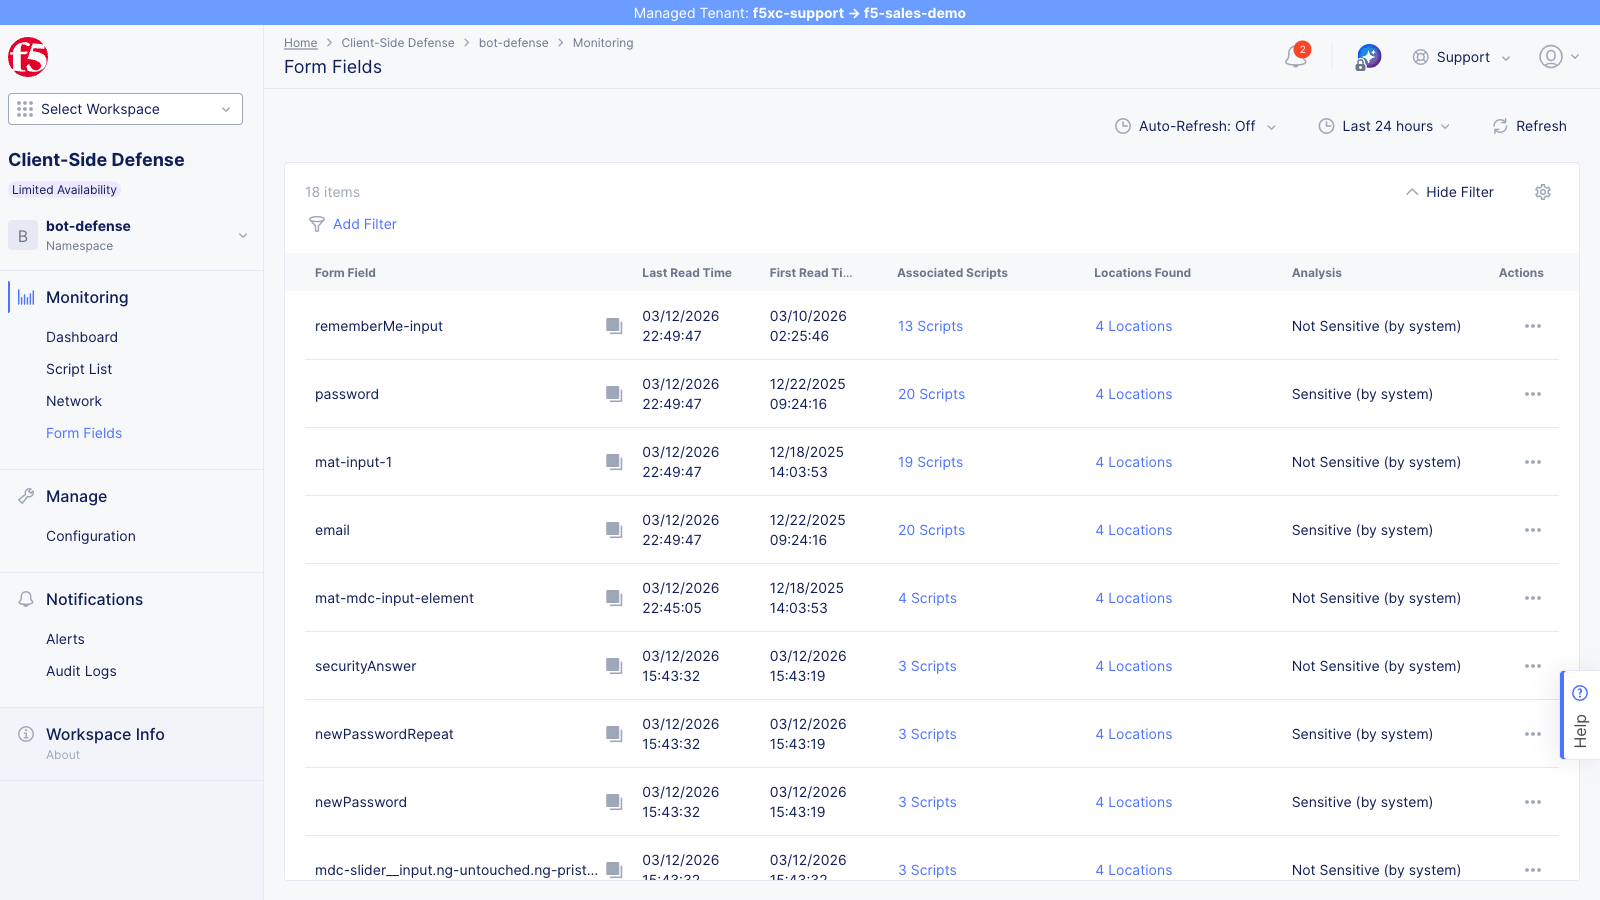
CSD automatically classifies fields by sensitivity:
| Form Field | Analysis | Description |
|---|---|---|
| Sensitive (by system) | Login email field — high risk if read by unauthorized scripts | |
| password | Sensitive (by system) | Login password field — high risk if read by unauthorized scripts |
Each field shows the number of associated scripts reading it, locations where reads were observed, and the last read timestamp. Drill into a field to see exactly which scripts are accessing it.
Network
Section titled “Network”Open the Network view to see all domains that scripts load from (not fetch/XHR destinations).
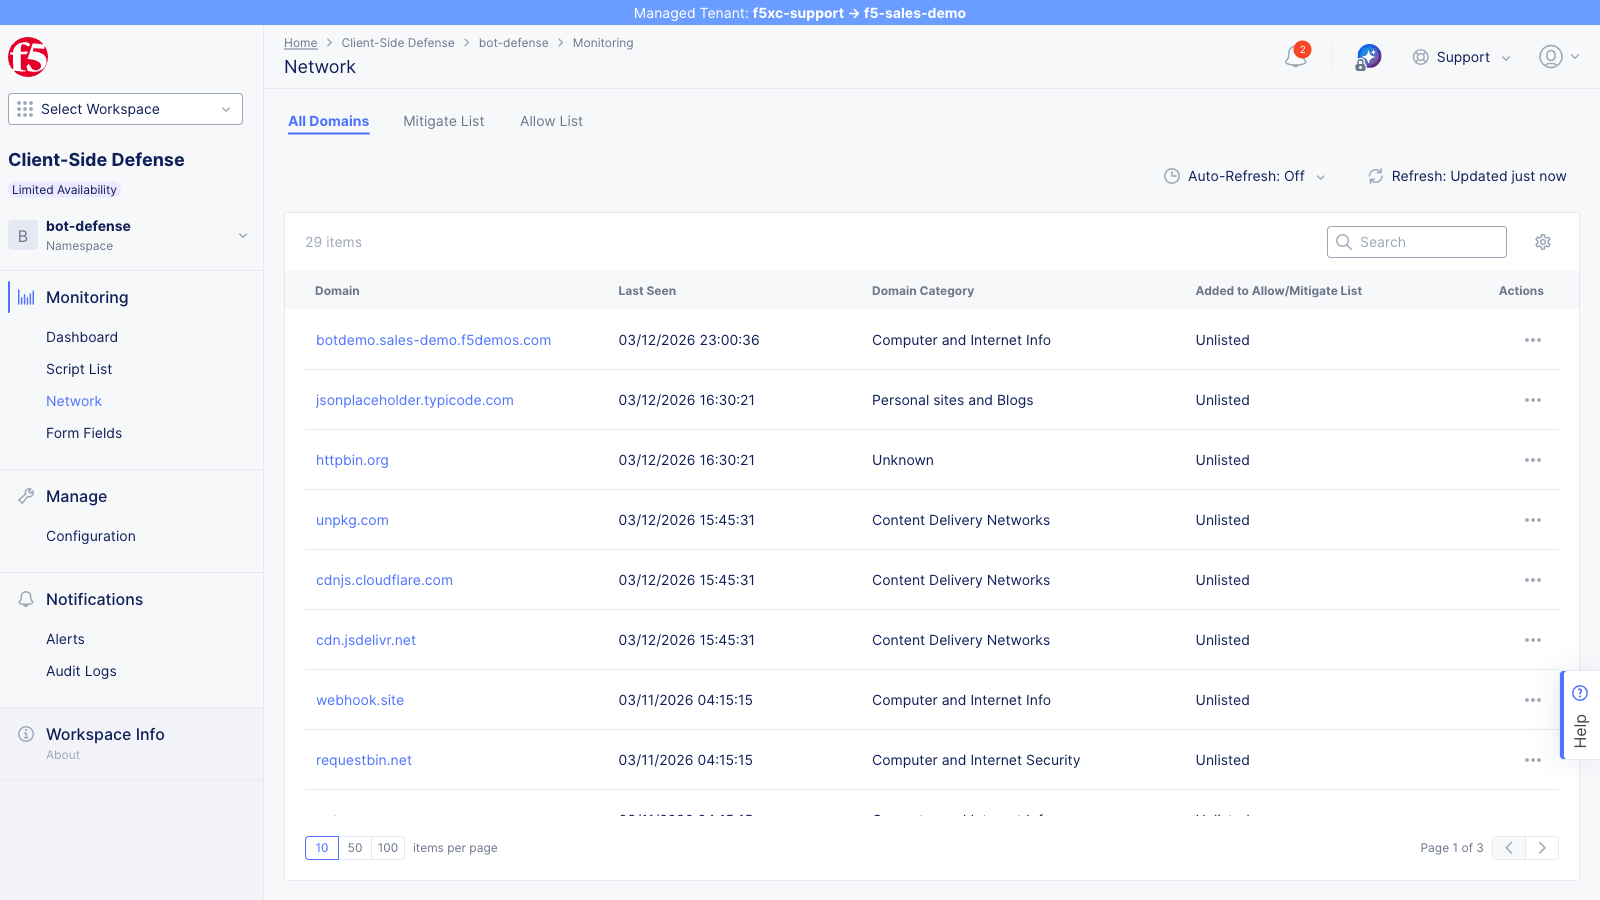
The All Domains tab lists each domain with:
- Last Seen timestamp
- Domain Category (e.g., Computer and Internet Info)
- Added to Allow/Mitigate List status (Unlisted, Allowed, or Mitigated)
After running the combined simulation, the same four CDN domains listed in the Dashboard section should appear as new entries because the injected <script> tags loaded JavaScript from these CDNs.
Use the Mitigate List and Allow List tabs to review domains that have already been actioned.
Affected Users
Section titled “Affected Users”The Affected Users tab (accessible from a script’s detail page) shows users impacted by the selected script.
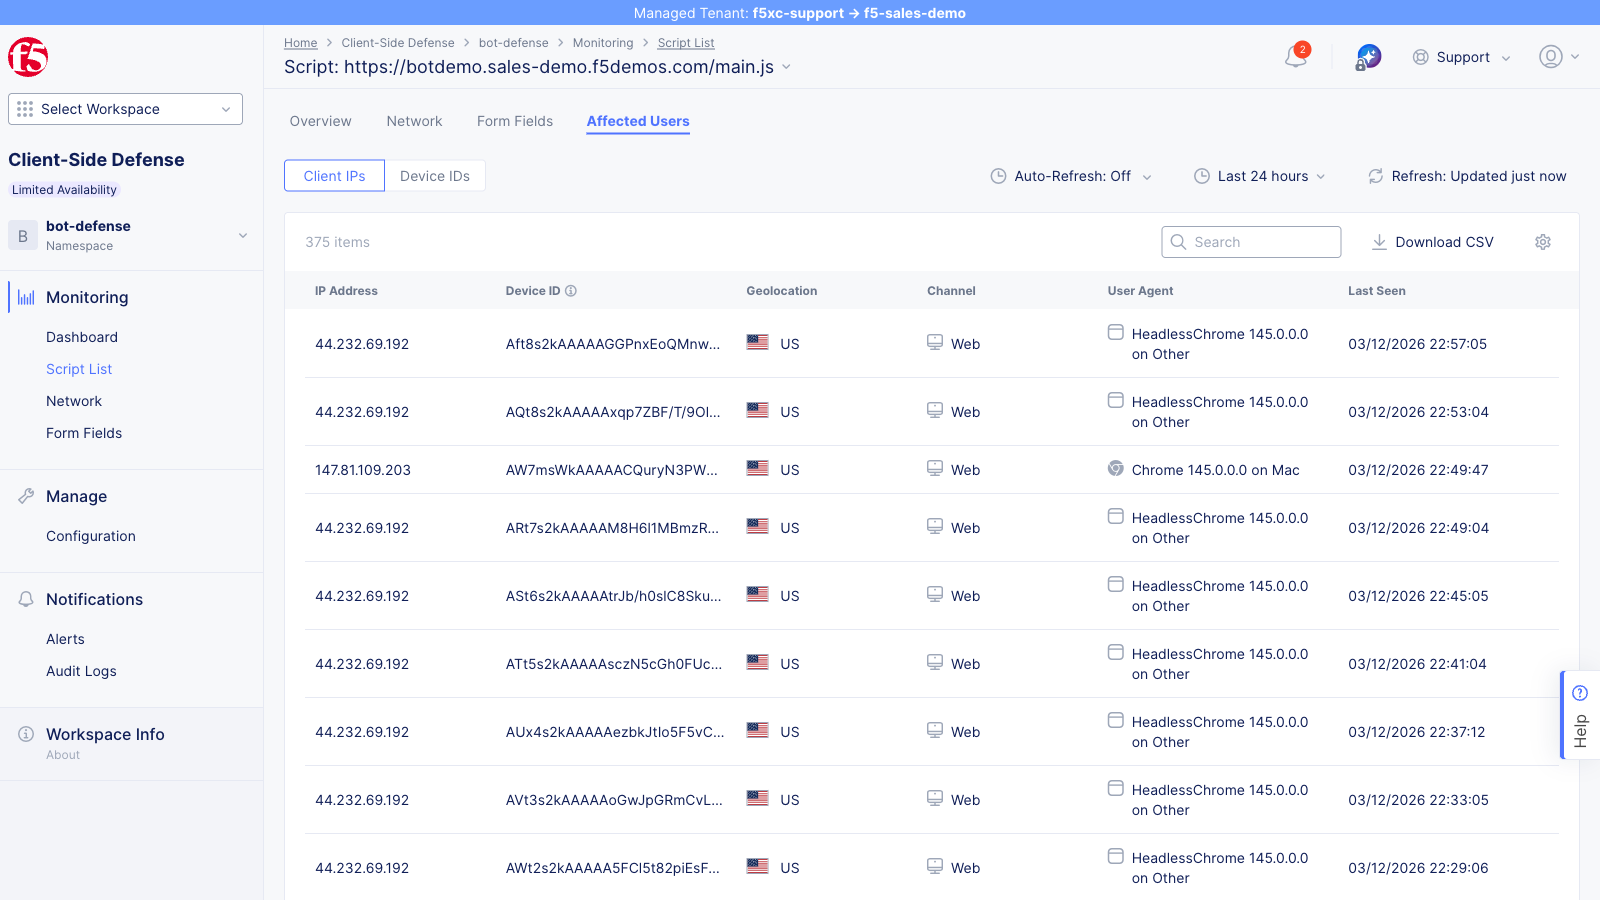
Each entry includes:
| Field | Description |
|---|---|
| IP Address | Source IP of the affected user |
| Device ID | Unique device identifier hash |
| Geolocation | Country derived from the IP (shown with flag icon) |
| Channel | Access channel (e.g., Web) |
| User Agent | Browser name, version, and operating system |
| Last Seen | Most recent detection timestamp for this user |
This view demonstrates the scope of a detected attack — how many users were exposed, from which locations, and on which platforms. Use this data to assess the impact of a formjacking incident and prioritize mitigation.
Alert Configuration
Section titled “Alert Configuration”Open the Notifications section from the left navigation to view the Alerts page.
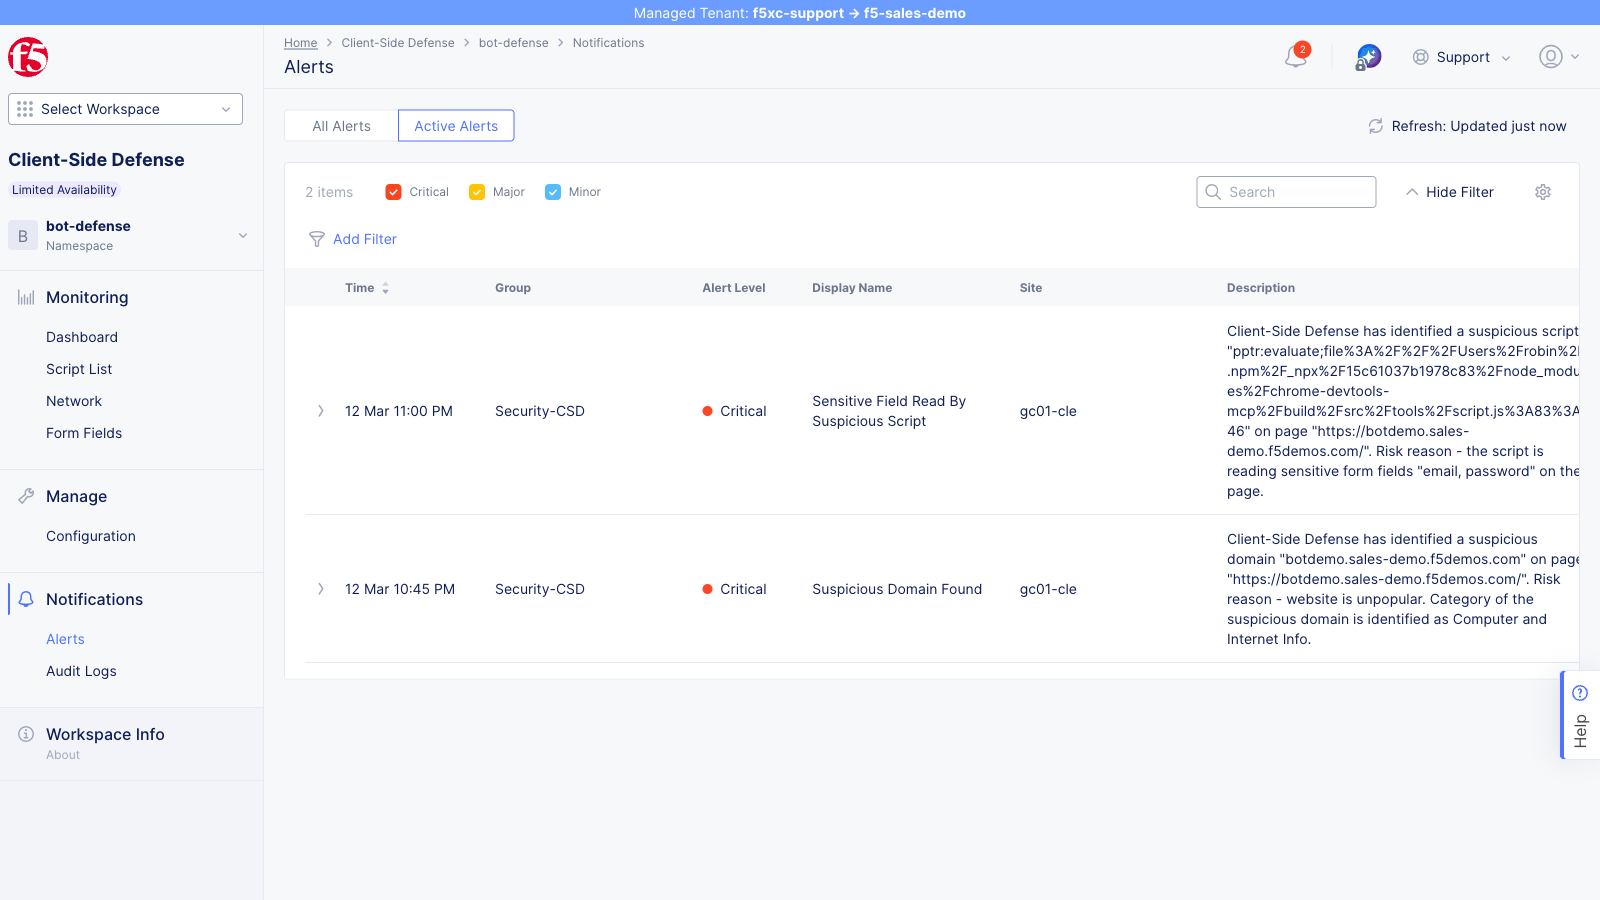
The Alerts page displays platform and CSD alerts for the namespace. Infrastructure alerts (such as endpoint healthcheck failures) appear automatically, but CSD-specific alert rules must be explicitly configured by an admin before script-detection notifications fire. Configurable trigger conditions include:
- New suspicious script domain detected
- Script risk score exceeds threshold
- New script detected on a monitored page
- Script behavior change (e.g., new form field reads)
Alerts can be scoped per-domain or globally, and email notifications are sent to the configured alert receiver.
Mitigation
Section titled “Mitigation”From the Dashboard, click the … actions menu on a flagged domain and select Add To Mitigate List. Alternatively, from the Script List, use the actions on individual scripts.
- Select a suspicious domain or script
- Click Add To Mitigate List
- Confirm the action — the domain status updates in the Actions column
- The domain moves from Action Needed to Found & Mitigated
The actions menu is the same one shown in the Dashboard section above.
Mitigated scripts are blocked from executing on the next page load. Mitigation is reversible — removing the domain from the Mitigate List restores script execution.
For programmatic mitigation via the API, see API Reference — Mitigation.